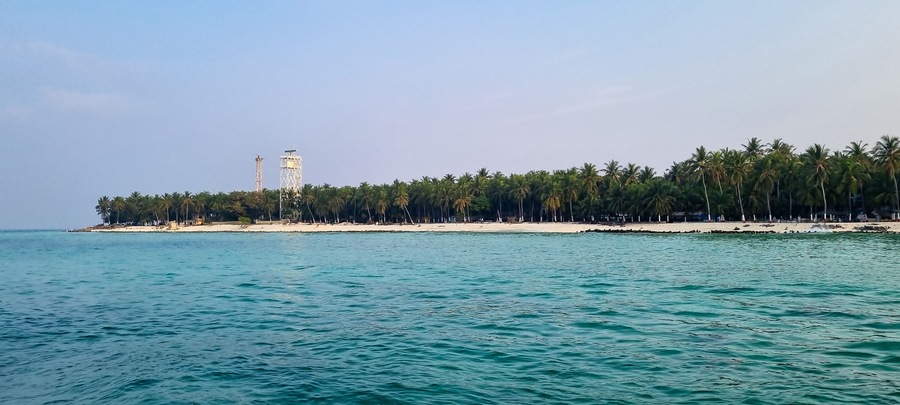
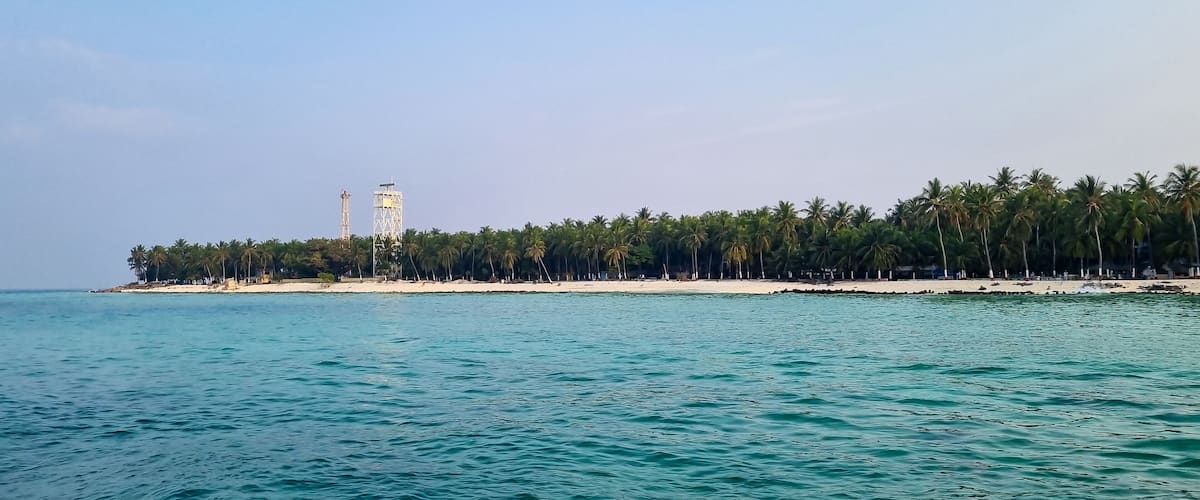
Best time to go to Minicoy Island
The best time to visit Minicoy Island can depend on the weather and when visitor numbers rise and fall. The hottest average temperature in Minicoy Island falls in May, when visitor numbers are slightly low and weather is mostly cloudy with moderate rain. The coolest average temperature in Minicoy Island falls in January, visitor numbers are average and weather is mostly sunny with no rain.
Calendar Month | Temperature | Precipitation | Cloudiness | Occupancy |
| January | 81.0°F (27.2°C) | No Rain | Mostly Sunny | Average |
| February | 81.3°F (27.4°C) | No Rain | Mostly Sunny | Slightly High |
| March | 82.8°F (28.2°C) | No Rain | Mostly Sunny | Average |
| April | 84.0°F (28.9°C) | No Rain | Mostly Sunny | Average |
| May | 84.2°F (29.0°C) | Moderate Rain | Mostly Cloudy | Slightly Low |
| June | 83.3°F (28.5°C) | Moderate Rain | Mostly Cloudy | Slightly Low |
| July | 82.4°F (28.0°C) | Moderate Rain | Mostly Cloudy | Average |
| August | 81.9°F (27.7°C) | Moderate Rain | Mostly Cloudy | Average |
| September | 81.9°F (27.7°C) | Moderate Rain | Mostly Cloudy | Average |
| October | 81.9°F (27.7°C) | Light Rain | Mostly Cloudy | Slightly Low |
| November | 82.0°F (27.8°C) | Light Rain | Mostly Sunny | Slightly High |
| December | 81.9°F (27.7°C) | Light Rain | Mostly Sunny | Slightly High |


Calendar Month
Temperature
Precipitation
Cloudiness
Occupancy